
Referencing - Tables & Graphs
Reprinted table or graph from a book
Copyright Guidelines
If you are preparing a thesis, or a paper for publication, or your work is going to be made publicly available in any way, you will need to ensure you have the correct permissions to re-use any images, data, tables and figures that you may reproduce in your work. For further information, refer to our Copyright pages
Guidelines
- Every graph or table needs a caption as part of its in-text citation.
-A copyright attribution needs to be included in reference list entry after the title, usually as Copyright YYYY by XXXX, for example, Copyright 2024 by Wiley Online.
Caption Requirements
-The word Table and a number (from 1, in numerical order), both in bold font at the top.
- A title or brief description of the table in italics. Include an in-text citation with author, year, and page number.
In-text Citation
Table Number
Table Title (Author, Year, Page Range)

Reference List
Author. (Year). Book title: Subtitle. Copyright attribution. DOI or URL
|
In text example |
Reference list example |
||||||||||||
|---|---|---|---|---|---|---|---|---|---|---|---|---|---|
|
Table 1 Properties of the Five Phases (Bone, 2021, p. 327)
|
Table from a physical book Bone, K. (2021). Functional herbal therapy: A modern paradigm for clinicians. Copyright 2021 by Aeon Books. |
Adapted table or graph from a book
Copyright Guidelines
If you are preparing a thesis, or a paper for publication, or your work is going to be made publicly available in any way, you will need to ensure you have the correct permissions to re-use any images, data, tables and figures that you may reproduce in your work. For further information, refer to our Copyright pages
Guidelines
-An adapted table is a table that already exists in a source, and you are using and adapting it for your own work.
-Every graph or table included in your assignment needs a caption.
-Include "adapted from" in the in-text citation to identify that this is a table you have adapted
-A copyright attribution needs to be included in reference list entry after the title, usually as Copyright YYYY by XXXX, for example, Copyright 2024 by Wiley Online.
Caption Requirements
-The word Table and a number (from 1, in numerical order), both in bold font at the top.
- A title or brief description of the table in italics. Include an in-text citation with author, year, and page number.
In-text Citation
Table or Figure Number
Table Title (Adapted from Author, Year, Page Range)
Reference List
Author. (Year). Book title. Copyright attribution. DOI or URL
|
Table 2 Essential Oils (Adapted from Lindquist et al., 2018, p. 327)
|
Adapted Table from an eBook Lindquist, R., Tracy, M. F., & Snyder, M. (Eds.). (2018). Complementary and alternative therapies in nursing (8th ed.). Copyright 2018 by Springer Publishing Company. https://ebookcentral.proquest.com/lib/think/detail.action?docID=5309079
|
Table or graph from a website
Copyright Guidelines
If you are preparing a thesis, or a paper for publication, or your work is going to be made publicly available in any way, you will need to ensure you have the correct permissions to re-use any images, data, tables and figures that you may reproduce in your work. For further information, refer to our Copyright pages
Guidelines
-Every graph or table included in your assignment needs a caption.
-A copyright attribution needs to be included in reference list entry after the title, usually as Copyright YYYY by XXXX, for example, Copyright 2024 by NSW Health
Caption Requirements
-The word Table and a number (from 1, in numerical order), both in bold font at the top.
- A title or brief description of the table in italics. Include an in-text citation with author, year, and page number.
In-text Citation
Table Number
Table Title (Author, Year)
Reference List
Personal or Corporate Author. (Last update or copyright year). Website Title. Copyright attribution. URL
|
Table - website (reprinted) |
Reference list |
|
Table 3 Selected CVD Conditions Managed by GPs, 2018-19 (Australian Institute of Health and Welfare, 2021)
|
Table from a webpage Australian Institute of Health and Welfare. (2021). Heart, stroke and vascular disease – Australian facts. Copyright 2024 by AIHW. https://www.aihw.gov.au/reports/heart-stroke-vascular-diseases/hsvd-facts/contents/ treatment-and-management/primary-health-care#what
|

Table or graph from a journal
Copyright Guidelines
If you are preparing a thesis, or a paper for publication, or your work is going to be made publicly available in any way, you will need to ensure you have the correct permissions to re-use any images, data, tables and figures that you may reproduce in your work. For further information, refer to our Copyright pages
Guidelines
-Every graph or table included in your assignment needs a caption.
-A copyright attribution needs to be included in reference list entry after the title, usually as Copyright YYYY by XXXX, for example, Copyright 2024 by ProQuest
In-text Citation
Table or Figure Number
Table Title (Author, Year, Page Range)
Reference List
Author. (Year). Article title. Journal Title, Volume (issue), page range. Copyright attribution. URL or DOI
|
In text |
Reference list |
|---|---|
|
Fig. 1 Psychological Stress during the COVID-19 Pandemic (Marashi et al., 2021, p. 8)
|
Table from a journal article Marashi, M. Y., Nicholson, E., Ogrodnik, M., Fenesi, B. & Heisz, J. J. (2021). A mental health paradox: Mental health was both a motivator and barrier to physical activity during the COVID-19 pandemic. PLoS ONE 16(4), pp. 1-20. Copyright 2021 by Public Library of Science. https://doi.org/10.1371/journal.pone.0239244
|
|
Fig. 9 Functions of Japanese (Leeming, 2011, p. 368)
|
Graph from a Physical Journal Leeming, P. (2011). Japanese high school students’ use of L1 during pair-work. International Journal of Applied Linguistics, 21(3), 360-382. Copyright 2011 by Oxford University Press. |

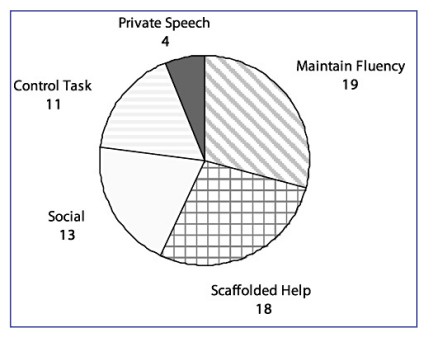
Table - constructed by yourself
Guidelines
- If the table is a compilation of data from multiple sources, you must include an in-text citation and full reference list entries for each source used.
-For tables that have been made using information from various sources, include a general note below the table to identify the sources that have been used. These sources should be listed in the form of an in-text citation.
- Every graph or table needs a caption as part of its in-text citation.
- Add a note at the bottom of the table to identify that it has been a table that has been constructed by yourself.
- If the data within the table is only your own, you do not need to include an in-text citation or a reference list entry.
Caption Requirements
-The word Table and a number (from 1, in numerical order), both in bold font at the top.
- A title or brief description of the table in italics. Include an in-text citation with author, year, and page number.
In-text Citation (Table with your own data)
Table Number
Table Title
Note: The data from this table has been recorded by myself.
In-text Citation (Table constructed with data from multiple sources)
Table Number
Table Title
Note: The data from this table has been sourced from (Author, Year, Page Range; Author, Year, Page Range;....Author, Year, Page Range)
|
In text example |
Reference list example |
||||||||||||
|---|---|---|---|---|---|---|---|---|---|---|---|---|---|
|
Table with data from multiple sources Table 1 Influenza Vaccination Rates Across Various Countries in 2024 (Ages Over 65)
Note: The data from this table has been compiled from (Health New Zealand Te Whatu Ora, 2024; National Centre for Immunisation Research and Surveillance Australia, 2024; UK Health Security Agency, 2024) |
Table with data from multiple sources Health New Zealand Te Whatu Ora. (2024). National Influenza Vaccine Data. https://www.tewhatuora.govt.nz/for-health-professionals/data-and-statistics/immunisation/national-influenza-vaccine-data#vaccination-uptake-over-time-age-65-years National Centre for Immunisation Research and Surveillance Australia. (2024). Influenza vaccination coverage data. https://ncirs.org.au/influenza-vaccination-coverage-data UK Health Security Agency. (2024). Seasonal influenza vaccine uptake in GP patients in England: winter season 2023 to 2024. https://www.gov.uk/government/statistics/seasonal-influenza-vaccine-uptake-in-gp-patients-winter-season-2023-to-2024/seasonal-influenza-vaccine-uptake-in-gp-patients-in-england-winter-season-2023-to-2024 |
||||||||||||
|
Table constructed from own data
Table 4 Daily Calories Intake and Combustion
Note. Data recorded by myself from 7th to 14th February 2022. |
Since the data within the table was only their own, they did not need to include an in-text citation or a reference list entry. |
